Zone of theoretical visibility maps
Zone of theoretical visibility maps
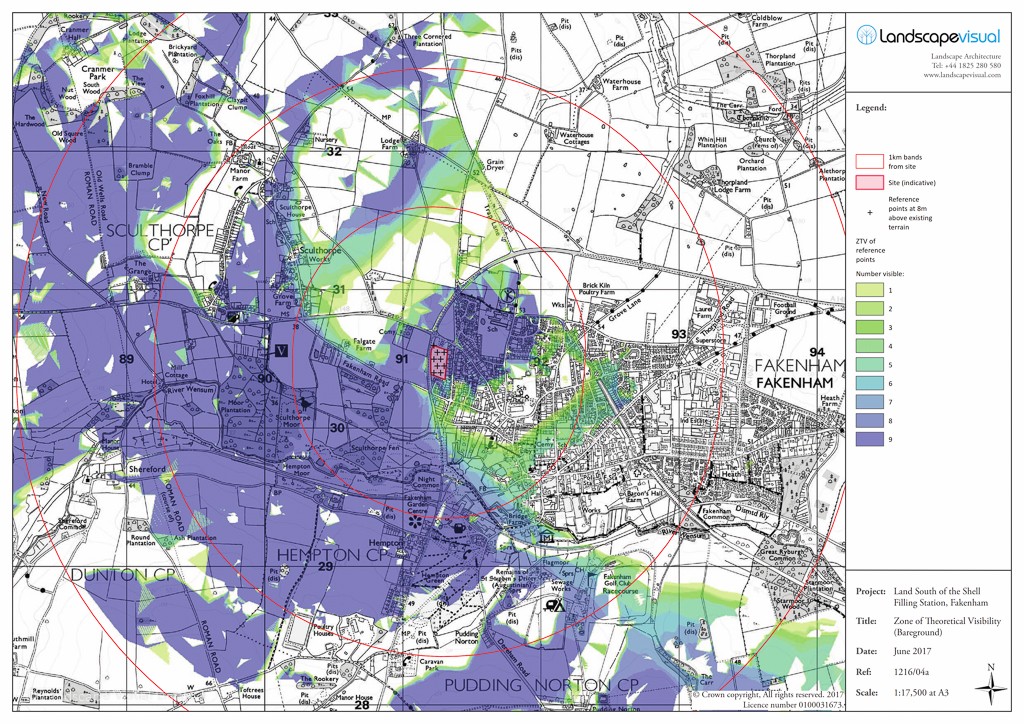
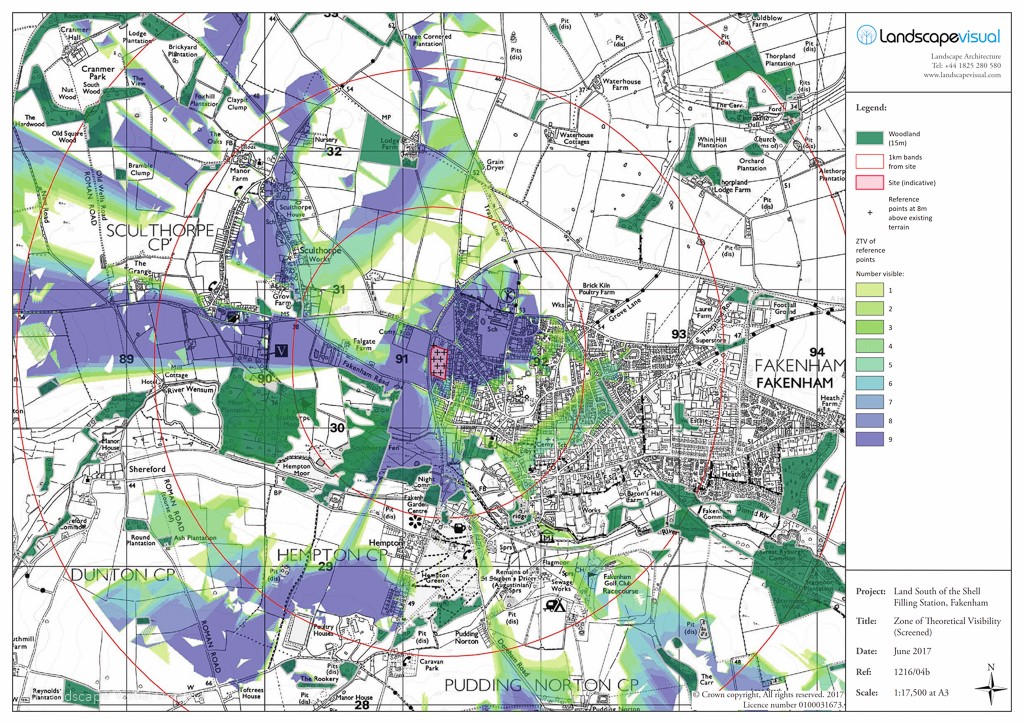
There are two principal types of ZTV:
- Bareground: where the underlying model just represents the topography, without screening vegetation or structures. These ZTVs depict the worst-case scenario.
- Screened: where the model includes topography as well as screening features.
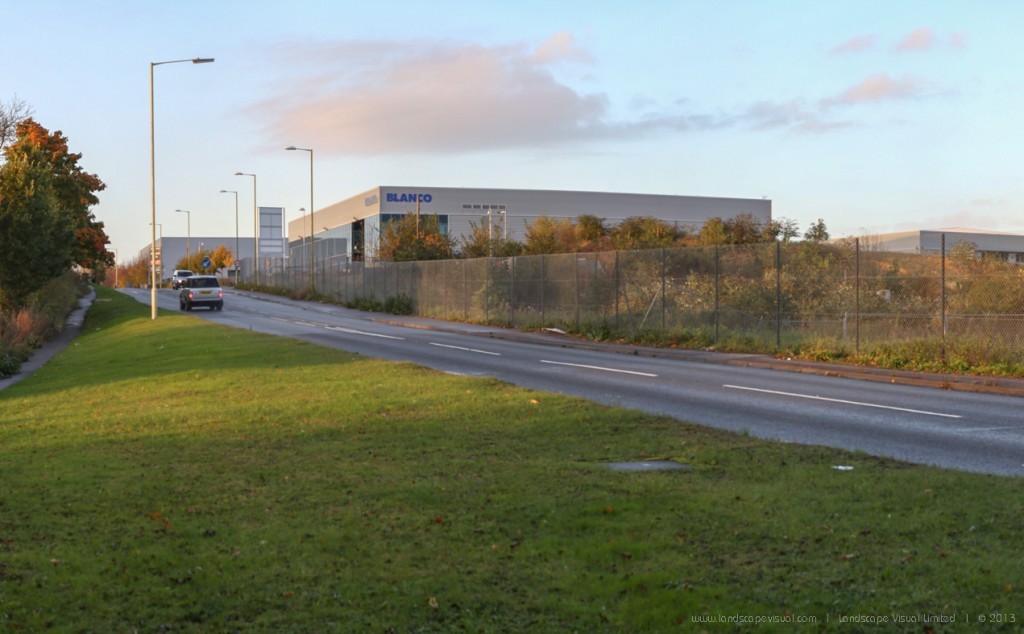
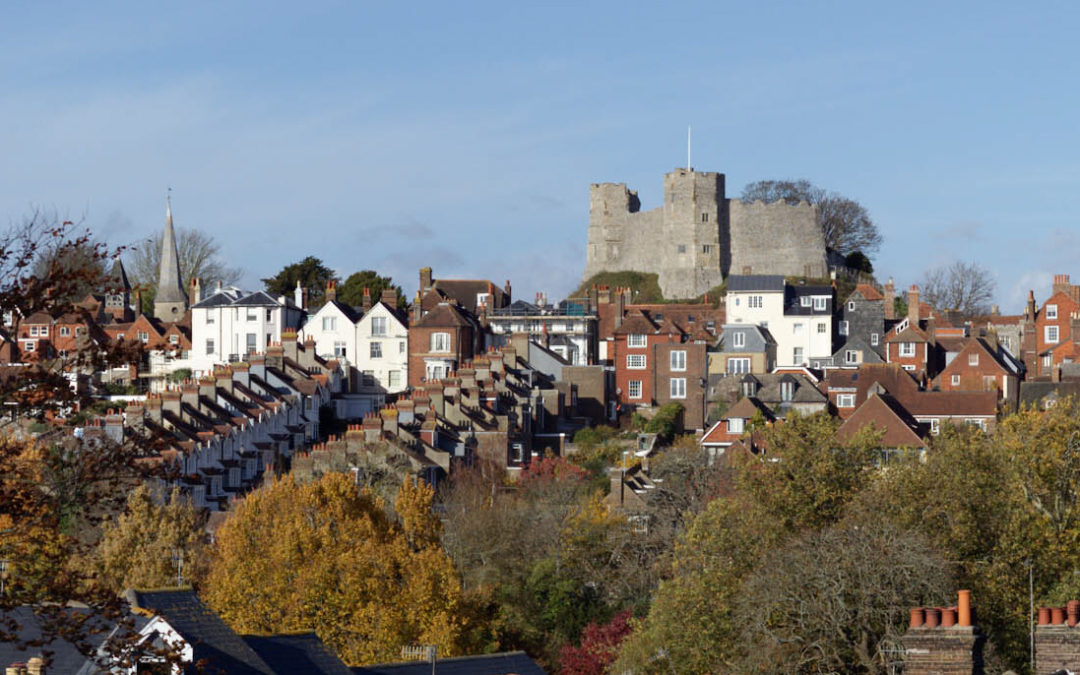
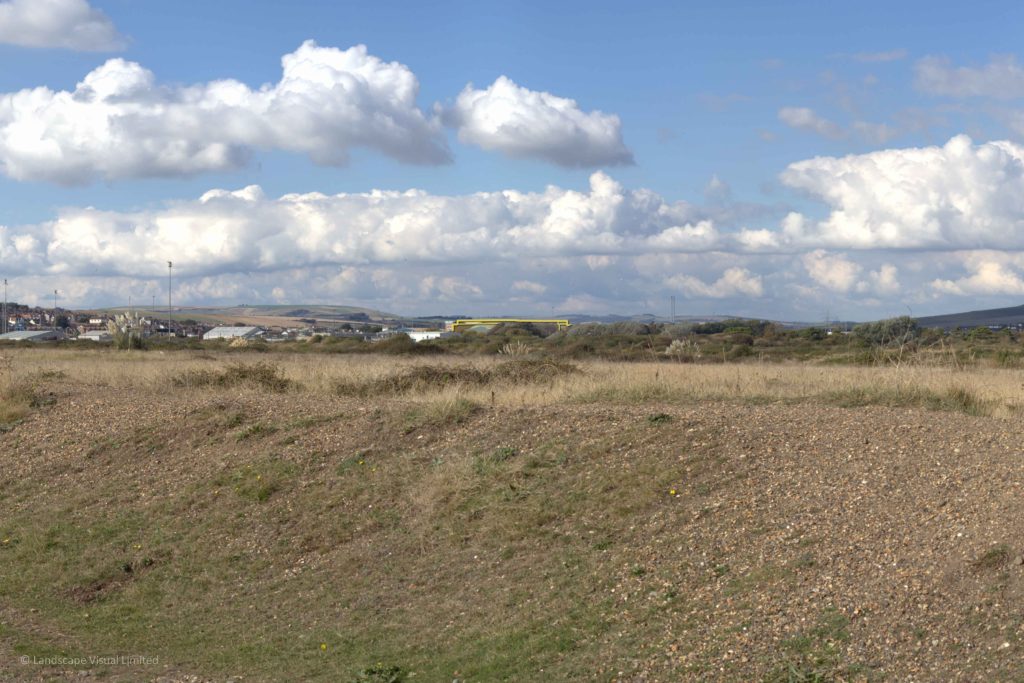
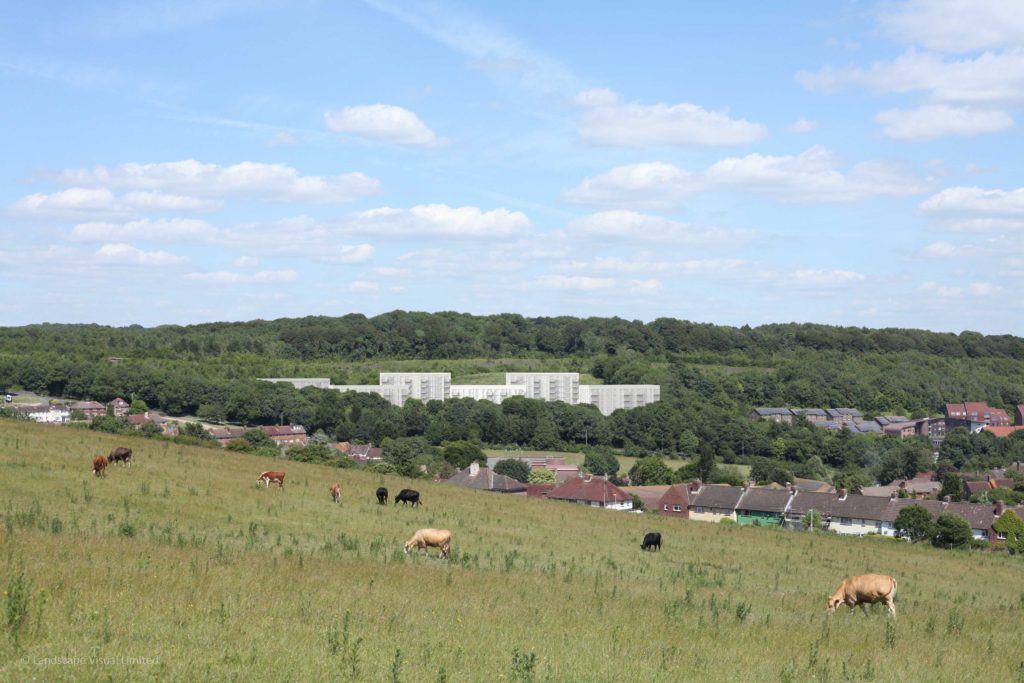
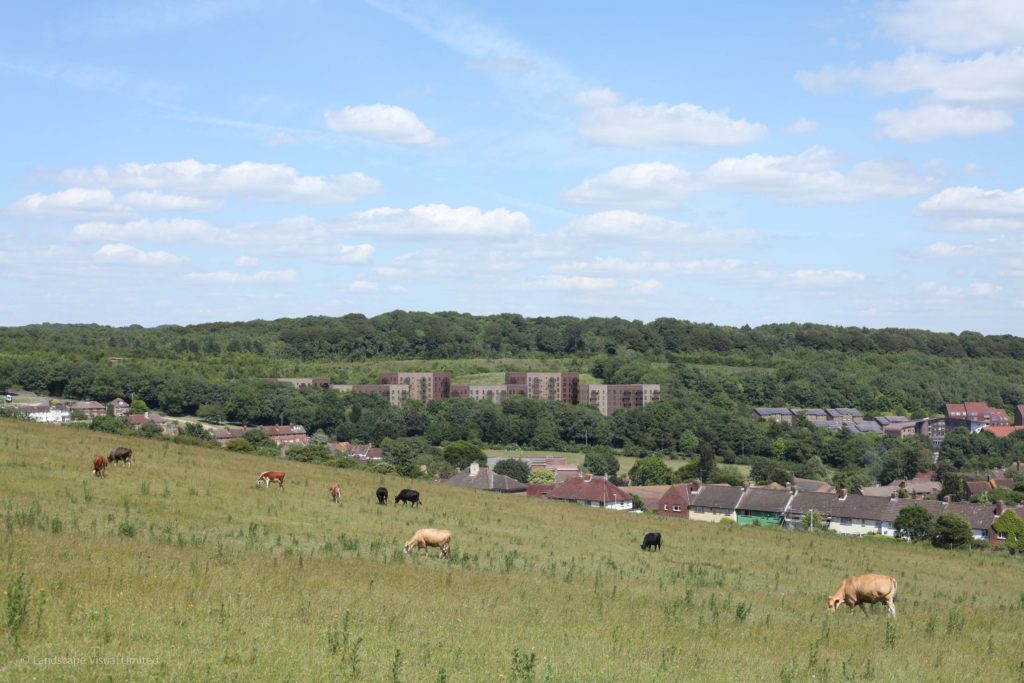
Clicking through the images below allows comparison of a bareground and screened ZTV for the same study area. Both are based on the same digital terrain model. The screened ZTV also takes into account the principal blocks of woodland as screening elements. The screened ZTV indicates a much reduced theoretical visibility compared to the bareground ZTV. Fieldwork confirmed the screened ZTV to be the more realistic depiction of theoretical views experienced near the site. However, features not included in the screening layer such as hedgerows, field trees and garden vegetation were confirmed to further reduce the extent of views compared to the screened ZTV model.
How ZTVs are calculated
A digital terrain model can be produced from various mapping sources. In the UK we commonly use Ordnance Survey terrain data, either the freely-available Terrain 50, or Terrain 5. Terrain 50 has an elevation value for each 50m by 50m area, which means the data is useful for very large areas or for initial, broad-brush studies. Terrain 5 has an elevation value for each 5m by 5m area and common data for producing ZTVs of development proposals where the LVIA study area may be between 2 and 5km from the site.
ZTVs are normally produced using scripts in Geographical Information System (GIS) software. The scripts can take into account earth curvature and atmospheric refraction (bending) of light, which influence visibility especially in more distant views. For example, viewpoints for wind farms may often be well 10 to 25km from the development.
Examples of ZTVs
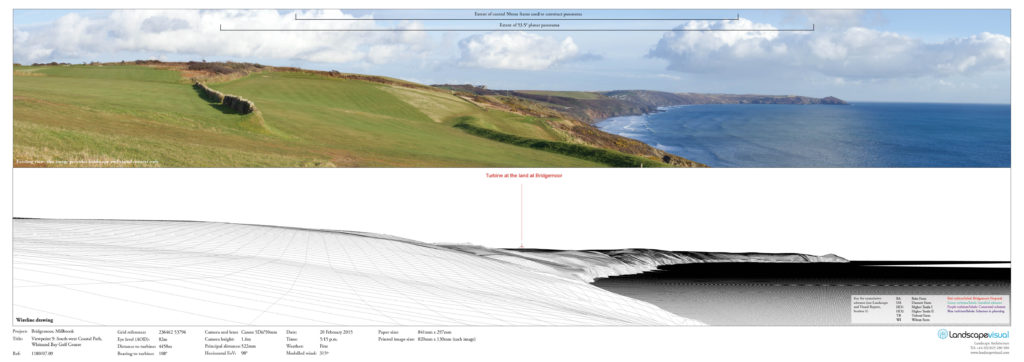
Wind farm ZTV
The plan below is a bareground ZTV for a single wind turbine. The ZTV is based on OS Terrain 50 and has been calculated to different heights to gain an understanding of where different parts of the turbine would be visible (e.g., the hub or the blade tips).
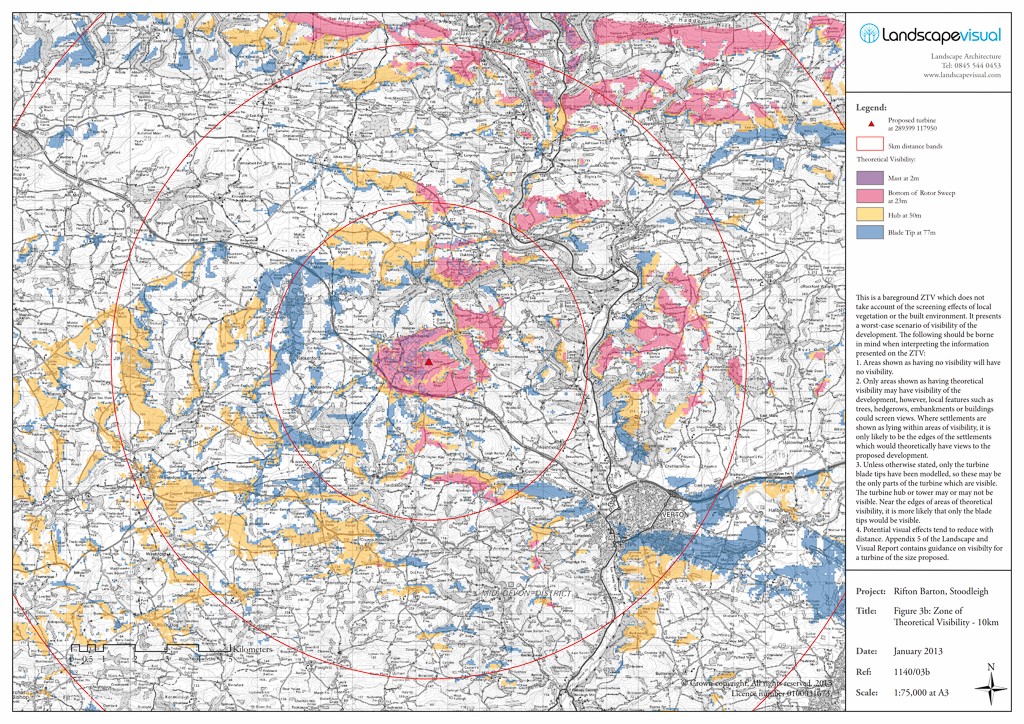
Wind turbine bareground ZTV plan (OS Terrain 50 digital terrain model)
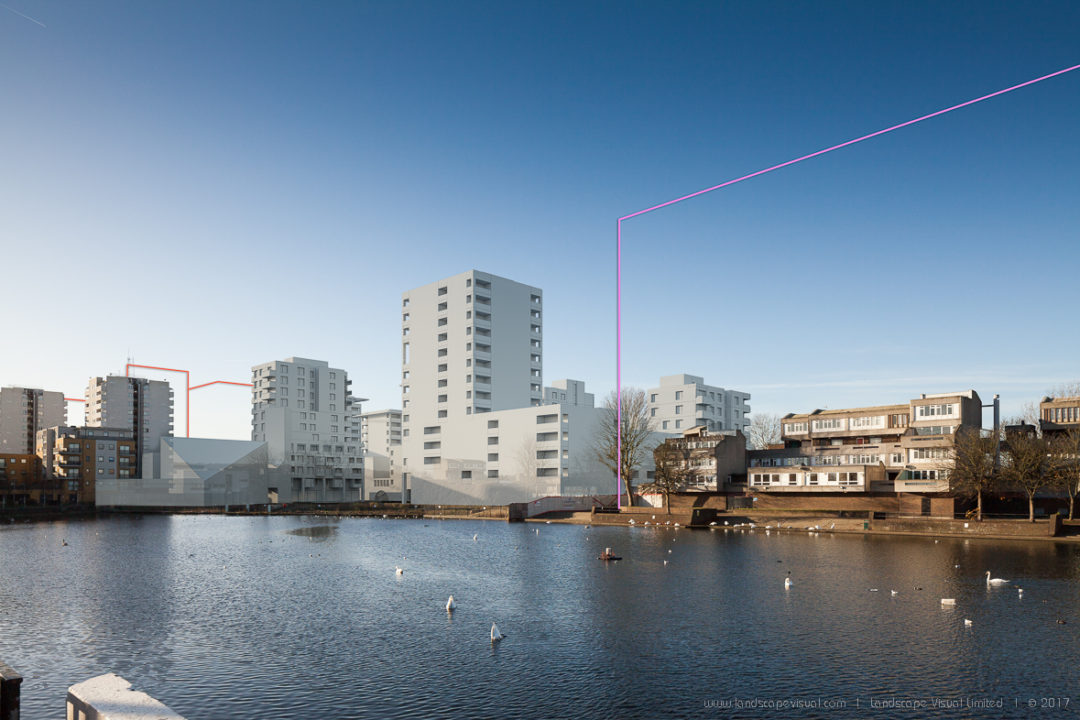
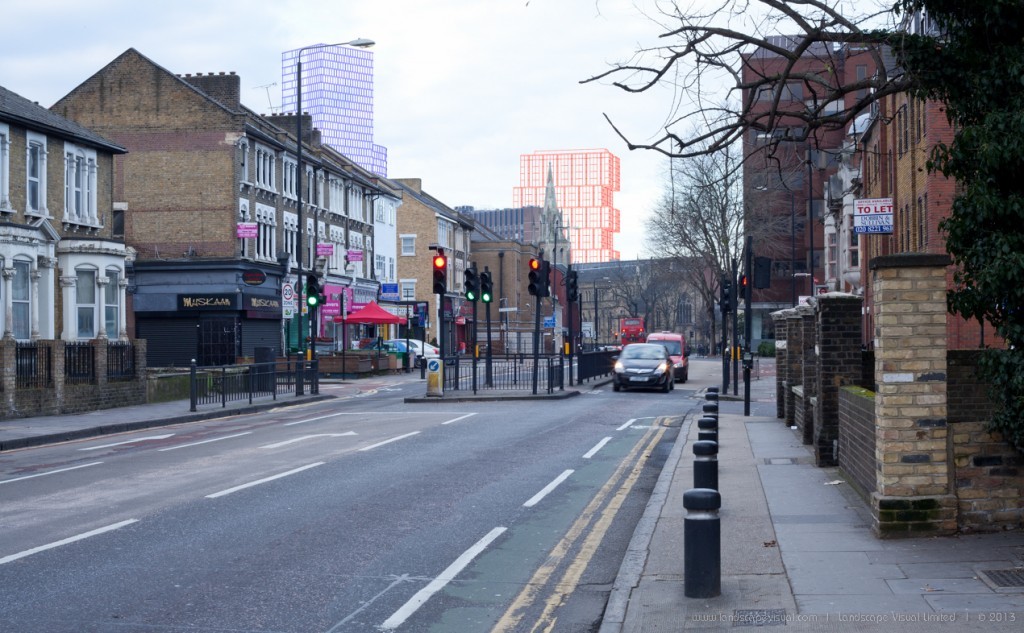
Fine-grained ZTV for tall building project
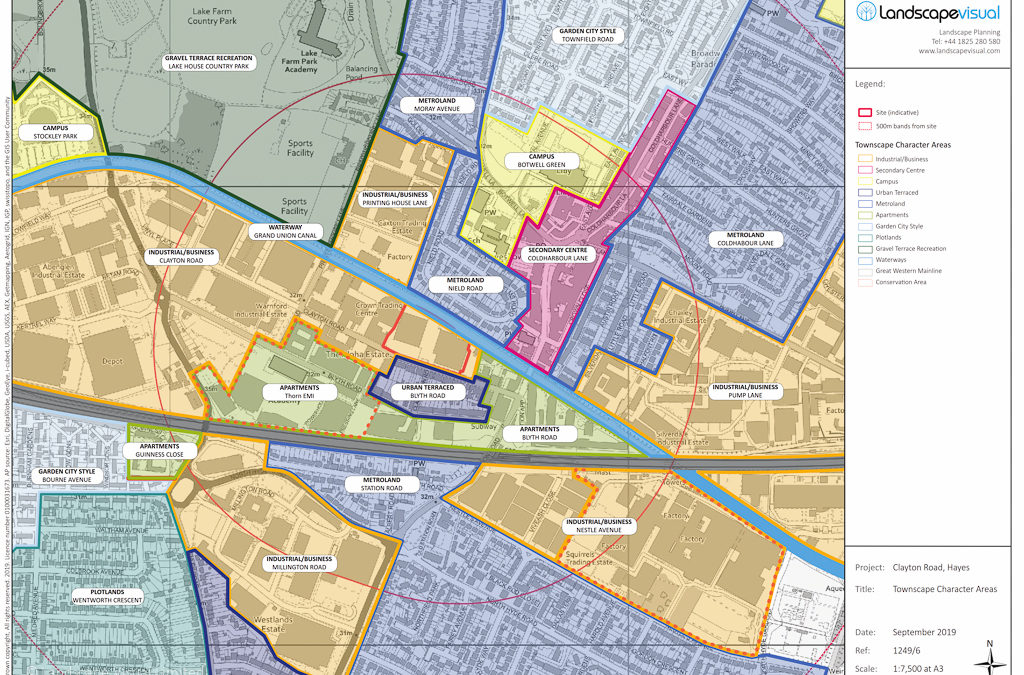
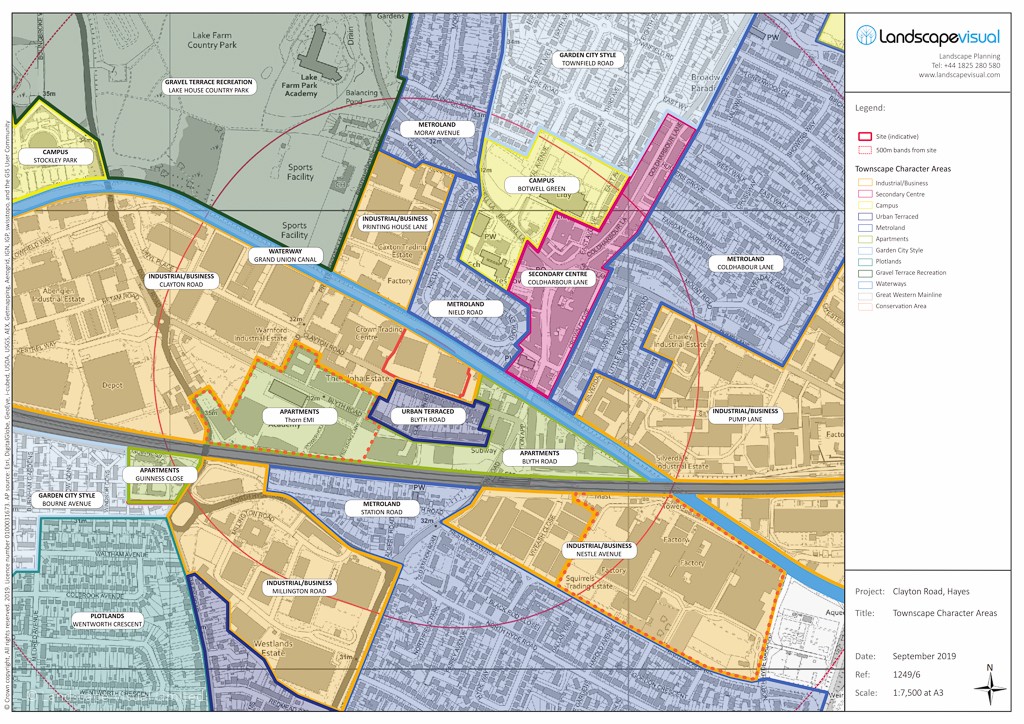
The image below shows a ZTV of a proposed tall building development. The ZTV is based on a digital surface model (DSM) comprised of Lidar survey data from the Environment Agency. The DSM shows 1m resolution data (an elevation reading for every 1m by 1m square) and includes buildings, vegetation and other surface features. In urban areas, this more detailed approach to ZTV modelling can be useful in identifying key view corridors along streets so helping to identify very specific potential views to a proposed development. In rural areas, the Lidar survey picks up hedgerows so ZTVs based on this data can give a more refined indication of theoretical visibility. Note that the ZTV output is theoretical and still requires interpretation. For example, theoretical visibility on the plan below is indicated from the roofs of buildings, which would not normally offer accessible public viewpoints.
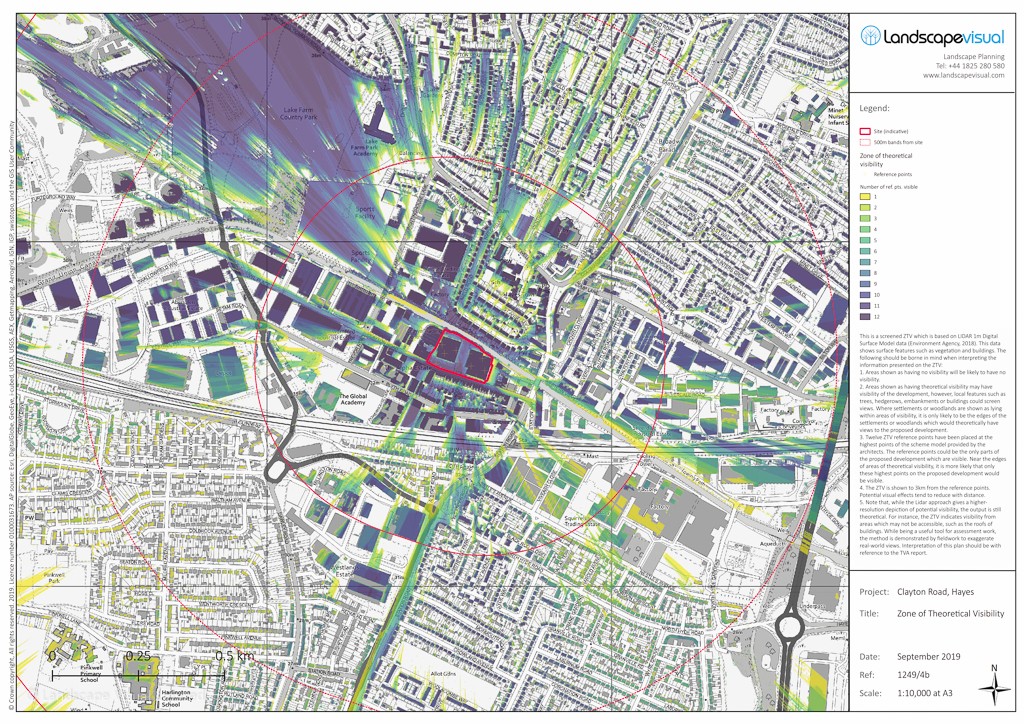
ZTV based on 1m Lidar survey data (Environment Agency)
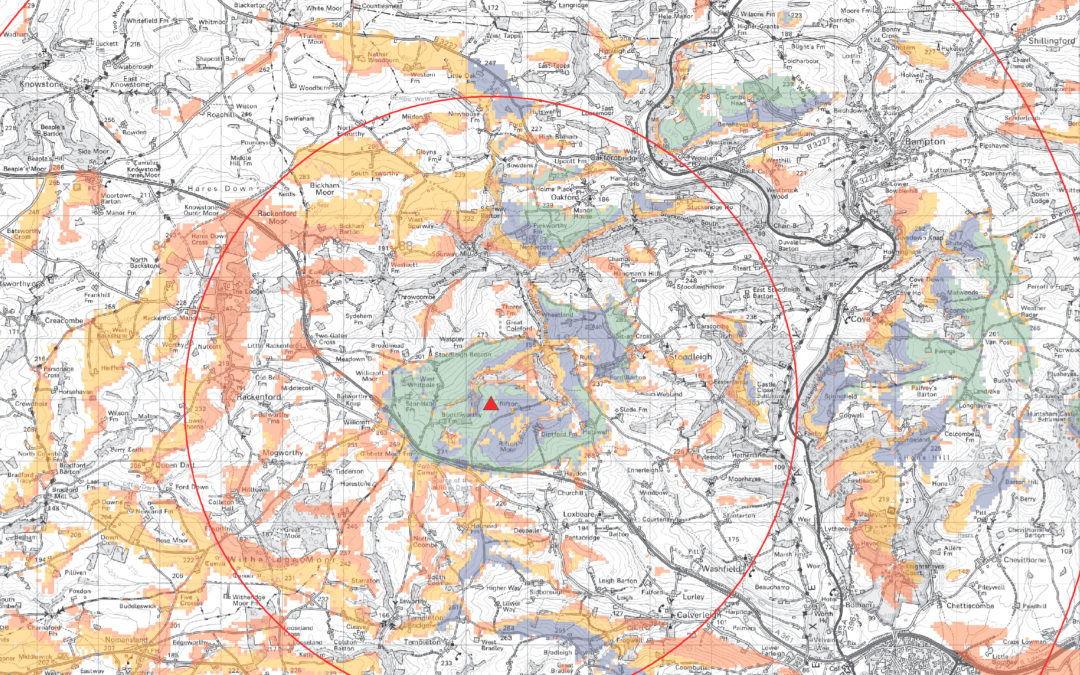
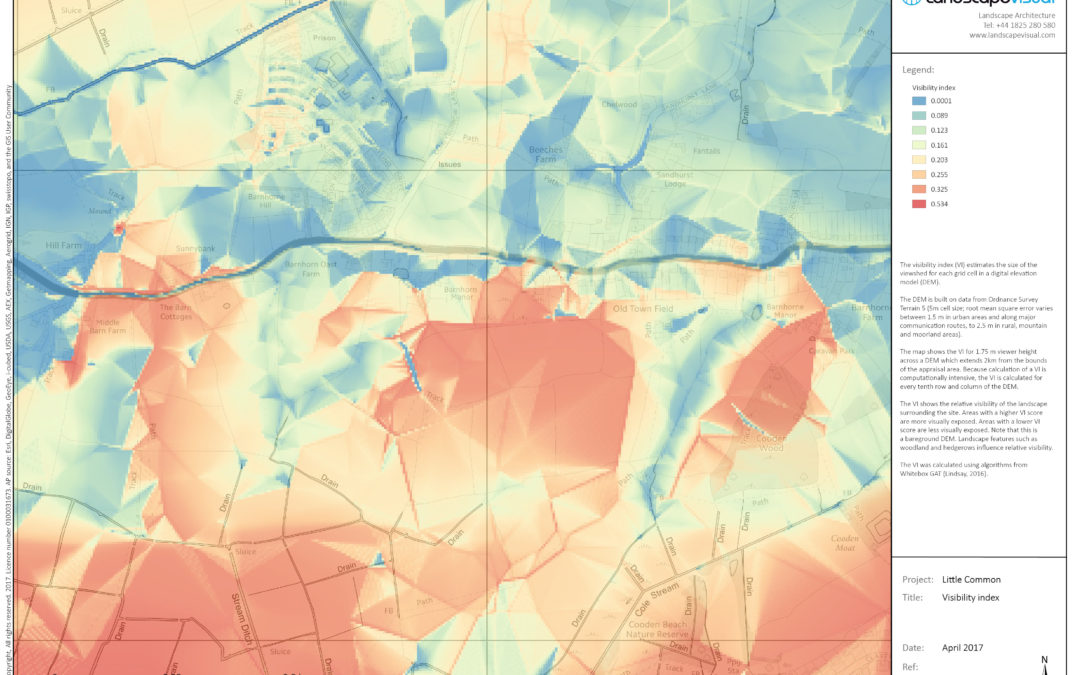
Visibility index
We can also use ZTV techniques to look at the relative visual exposure of a landscape. The visibility index (VI) is theoretical output which gives an estimate the size of the ZTV for each grid cell in a digital terrain model. This can be very useful where there is a large site, only part of which is required for the proposed development. The VI calculation can help identify areas of lower or higher sensitivity. An example VI map is provided below. The red areas are relatively more visible from other parts of the DTM than the blue areas.
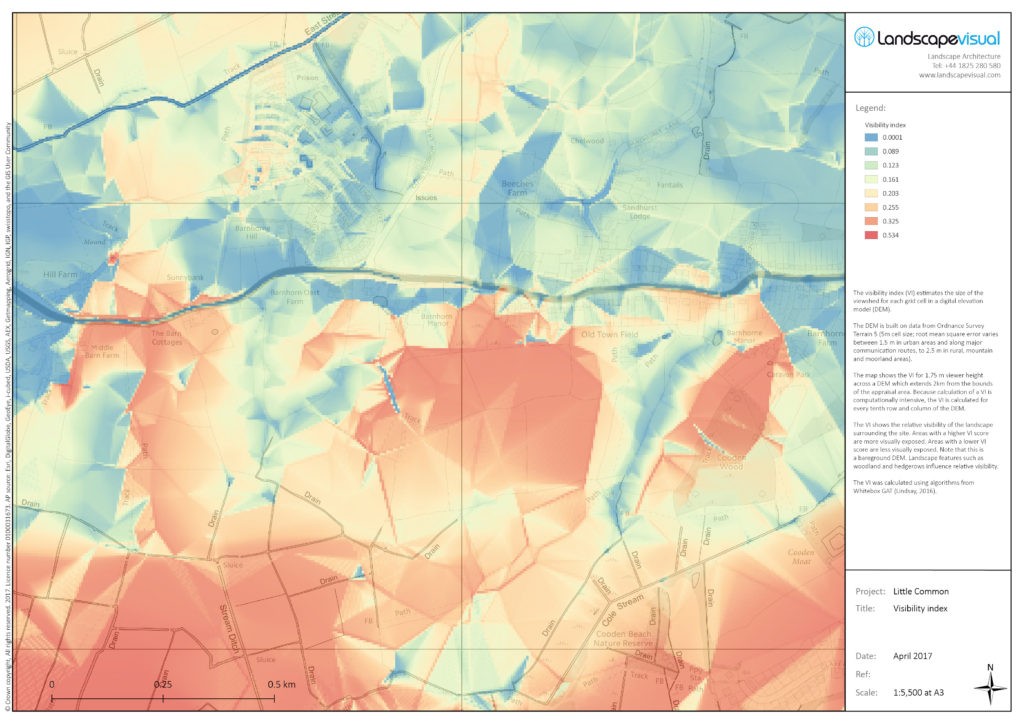
Visibility index plan, showing the relative visual exposure of the area covered by the digital terrain model
Interpretation of ZTVs
A ZTV shows the theoretical areas from where a development would be visible or not. The ZTV does not indicate the nature or significance of effects which would be likely to arise.
ZTVs can be very useful in early project stages to help identify the main areas of potential views. This can assist in locating assessment viewpoints and highlighting key receptors.
ZTV analysis can also be very useful in comparing development options, for example layouts which use different parts of a residential site, or different wind turbine heights.
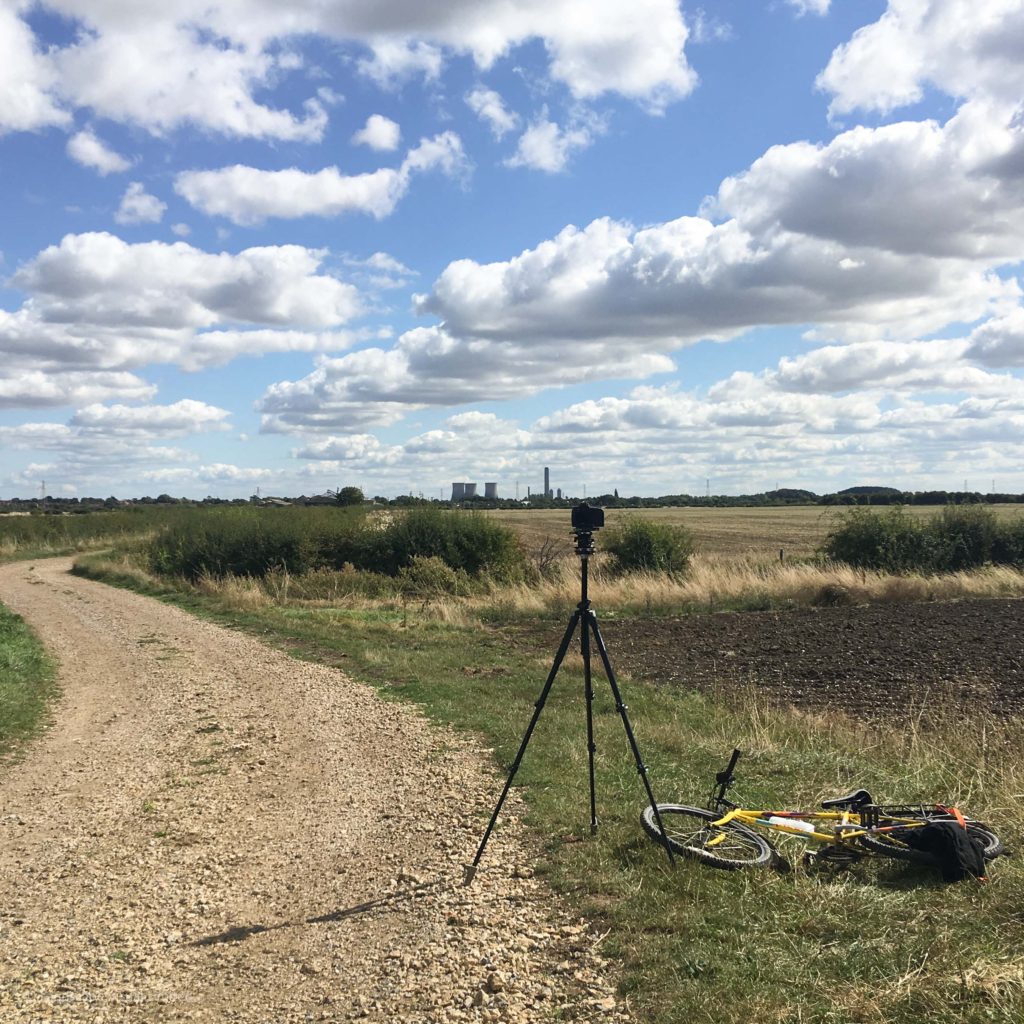
It should be borne in mind that a ZTV will only be as accurate as the data on which it is based. It is normal for the landscape architect to verify the representativeness of the ZTV when doing LVIA site work.
Summary
ZTVs are potentially a powerful tool for landscape and townscape assessment work. There are various methods and data which can be used to produce ZTVs. Their application and interpretation needs careful consideration. In particular, it should be remembered that they only illustrate theoretical visibility.
Take a look at some of our projects, most of which will have involved some sort of ZTV modelling.